Buffer Depletion, Signal Habituation, and the Mispricing of Hormuz — v1.0, as of 10 July 2026
Editorial note: This is a dated snapshot, current as of 10 July 2026. The buffer-state Monte Carlo behind Section 6 is built and validated against the February–June episode; because one input — the July days-of-cover figure from the IEA Oil Market Report — publishes only mid-month, Section 6's magnitudes are reported here as ranges across the plausible cover band rather than as point estimates. This analysis will be updated when the July IEA OMR publishes, with the single figure dropped as a marker on the Section 6 exhibit and the magnitudes finalised; the pre-registered paragraphs and the ledger's direction do not depend on it. Model code and configuration are available on request.
Update — Part II (11 July): Hormuz Is Not Reopened — a Controlled High-Risk Corridor as a Second Diesel Shock Emerges extends this argument as the downstream squeeze it predicted begins to surface. Part III (13 July): Europe's Self-Inflicted Exposure traces the same fragility to Europe's own energy choices.
1. The anomaly
On the morning of 8 July, a gas carrier caught fire eight nautical miles east of Limah after being struck in the Strait of Hormuz. Iran fired missiles at commercial shipping. American forces struck Iranian targets; Iranian forces retaliated against American bases. The President of the United States declared the three-week-old ceasefire dead and publicly floated strikes on Kharg Island — the terminal through which the great majority of Iran's crude exports flow.
Brent crude rose almost 5 per cent to about $78 on Wednesday — a two-week high — then gave part of it back to around $76 on Thursday, leaving the benchmark up roughly 6 per cent on the week but still mired in the mid-$70s and still, on the Brent–Dubai structure, in contango. Goldman Sachs and Morgan Stanley continued to warn clients about a returning glut. OPEC+ confirmed its fifth consecutive monthly production increase.
Tankers were burning in the world's most important oil chokepoint, a superpower's president had declared the ceasefire dead, and the strait itself had gone quiet — by Thursday, visible traffic through Hormuz had slowed to a near standstill, with Lloyd's List Intelligence unable to identify a single large vessel transiting the Omani corridor with its transponder active since 7 July — what traffic remained was crossing dark. And Brent moved under five per cent, half of it gone by the next session. Four months earlier, a qualitatively similar shock in the same water had taken the benchmark from $67 to $126. The market did not ignore the July strike; it priced it at a small fraction of February's amplitude — that shock moved Brent 88 per cent, this one under five — and began surrendering even that within a day. Not a shrug, exactly: a whisper where February had screamed. The distance between those two responses is the subject of this piece.
There are two available explanations. The first is that the market knows something: that the ceasefire's collapse is theatre, that the strait leaks barrels even when nominally closed, that Chinese demand is soft and supply is returning, and that the February–June crisis demonstrated the system's resilience. The second is that the market is measuring the wrong variable — that the flat price is a competent estimate of one quantity and completely blind to another, and that the quantity it cannot see has moved violently since February.
This piece argues for the second explanation, and it does so by counting. The February–June closure was absorbed by a specific, enumerable set of shock absorbers. Every one of them can be inventoried, and every one of them is today consumed, converted, compressed, or inverted. The system that faces the second shock is not the system that absorbed the first. The price is the same as it was in February. Almost nothing else is.
2. How round one was actually absorbed
The conventional narrative of the past four months is a story about resilience: the strait closed on 28 February, prices spiked, diplomacy worked, the strait reopened, prices round-tripped. Brent went from $67 to a peak near $126 in April and back to around $70 by early July (before the strikes). The system bent and did not break.
The cascade reading is different. The February–June closure was not a shock the system shrugged off; it was a cascade that was arrested — caught, at real cost, by five distinct absorbers, each of which did measurable work. Understanding round two requires an honest audit of round one.
The strategic reserves went first. On 11 March, thirty-two IEA member nations agreed to a coordinated release of 400 million barrels of crude and products — the largest in the agency's history. The American share alone was 172 million barrels from the Strategic Petroleum Reserve, discharged over roughly 120 days. This was the designed function of the post-1973 emergency architecture, executed at full scale, and it worked: Atlantic Basin crude exports to markets east of Suez rose by some 3.5 million barrels per day during the war, backfilling the Gulf shortfall.
Commercial inventories went second. Global observed inventories drew at an average pace of 3.8 million barrels per day from the conflict's start — 143 million barrels in May alone. OECD industry stocks bore the brunt of it, falling counter-seasonally through the weeks of the year when they normally build.
Spare capacity was mobilised. OPEC+ producers with capacity outside the strait's shadow, alongside American, Brazilian, and Guyanese output, lifted what they could lift. Rerouting infrastructure — the Saudi East–West pipeline to the Red Sea, the ADNOC line to Fujairah — carried barrels around the chokepoint at close to effective capacity.
Prices destroyed demand. At $105–126 Brent, second-quarter global deliveries fell by roughly 5 million barrels per day year on year — through market rationing at the pump, and through administrative rationing behind it: price caps, subsidies, conservation mandates, four-day working weeks. Full-year 2026 demand is now forecast to decline by 1.1–1.2 million barrels per day, the first annual contraction since the pandemic.
And the closure leaked. Substantial volumes moved through Hormuz even at the disruption's peak — dark transits with weakened or disabled transponders, ship-to-ship transfers in the Gulf of Oman, cargoes surfacing in tracking data days after the fact. Flow through the strait bottomed near 9.6 million barrels per day in May against a pre-war baseline around 17: a severe constriction, never a seal.
Five absorbers, all functioning, all costly. The relevant question for July is not whether they worked. It is what remains of them.
3. The buffer ledger
Markets price events. Cascade analysis prices states. The question that matters after 8–9 July is not whether the strait will be disrupted again — the flat price has an opinion on that, and it may even be right — but what condition the system would be in when it happened. That condition can be enumerated.
| Absorber | State, late Feb 2026 | State, early Jul 2026 | Restoration timescale | Status |
|---|---|---|---|---|
| US Strategic Petroleum Reserve | ~415 mb (~58% of capacity) | 319.5 mb (week ending 3 Jul) — lowest since April 1983; release programme running toward ~243 mb, against a ~250 mb hydraulic operational floor | Exchange returns scheduled Nov 2026 – Sep 2028; recovery to pre-conflict level estimated ~mid-2028 | Spent to the floor |
| IEA coordinated release | 400 mb authorised across 32 states — fully available | Substantially executed; OECD government stocks down 163 mb, lowest since December 1990 | Political, not physical: a second release of comparable size has no precedent and thinner stocks behind it | One-shot, fired |
| US commercial inventories | Crude near the top of the 5-year range | Crude 408.4 mb after ten consecutive weekly draws, ~7% below the 5-year average, counter-seasonal; gasoline −7%, distillate −8%; refinery utilisation 96.6%; total US crude including SPR at 734 mb, the lowest since 1984 | Rebuild requires a sustained surplus at the very moment US barrels backfill Atlantic Basin exports | Below seasonal norms, still draining |
| OECD commercial inventories | >70 days forward demand cover | ~50 days on available computations (derived from market commentary; final IEA figure mid-month); EIA projects OECD stocks below 2.3 bn bbl by December — the lowest in records dating to 2003 | Meaningful restocking pencilled for 2027, contingent on an ~8 mb/d supply rebound arriving on schedule | Compressed; direction robust (well below 70), point estimate pending the OMR; the restock is a forecast, not a fact |
| OPEC+ spare capacity | ~1.65 mb/d of held cuts, deployable | Fifth consecutive monthly increase (+188 kb/d for August); ~379 kb/d of the 2023 cuts remaining, potentially fully unwound by September. Shut-ins — 11.2 mb/d at the May peak, 8.3 mb/d in June — still average 1.4 mb/d into 4Q26 | Spare capacity is not restored by unwinding cuts; it is deleted by it. Rebuilding genuine surplus runs on multi-year investment cycles | Converting from buffer to flow |
| Demand destruction | Latent — activated by price | Did its work at $105–126; in the mid-$70s the mechanism runs in reverse as priced-out consumption returns and re-tightens the balance | Instantaneous — and symmetric | Reversing |
| Floating storage | Normal in-transit levels | ~60 mb of Iranian oil on water (estimates 58–68 mb) following the US sanctions waiver — over 20 mb idling ≥7 days in Asian waters, building ~18% week-on-week, >90% with no declared destination. The war's stranded overhang already liquidated: global floating storage fell 47 mb in the week to 10 April as trapped tankers discharged | Clearing is discount-gated, not logistics-gated — the barrels move when China's independents buy; the flow behind them exists only while the waiver holds | Transformed — a policy-gated surplus, coupled to the controller |
Three things follow from the ledger that no flat-price chart will show.
First, every line points the same direction. There is no absorber on this list stronger now than in February. Five are consumed, converted, or compressed; one has reversed sign; and the seventh has changed species. The floating barrels feeding July's glut optics are no longer the war's stranded cargo working its way to port — that overhang liquidated in a single April week, when the ceasefire announcement freed trapped tankers and Middle East floating storage collapsed from 55 million barrels to under 9. What sits on the water now is roughly sixty million barrels of Iranian crude called into existence by the US sanctions waiver, over ninety per cent of it with no declared destination, accumulating rather than draining as China's independent refiners buy elsewhere. It suppresses prompt prices exactly as a surplus should — while existing entirely at the sufferance of a waiver that a single Kharg Island strike, or one signature in Washington, would revoke. The market is drawing comfort from a cushion that the two parties to the conflict can jointly or separately delete. Systems analysis has a name for the condition in which apparent surplus coexists with exhausted reserves, and it is not "resilience."
Second, the timescale mismatch is the mechanism, not a detail. The interval between the first shock and the second probe was a little over four months. Set that against the restoration column: SPR refill to roughly 2028, shut-in production to the first quarter of 2027, OECD restocking through 2027, genuine spare capacity on a multi-year investment cycle. When buffer restoration time exceeds shock recurrence interval, each successive shock arrives at a lower system state than the last. That is the defining signature of a compound cascade, and it is why "the market absorbed it last time" is precisely the wrong induction. It is also why the SPR's engineering matters more than its politics: the reserve can discharge roughly six times faster than it can be refilled. The system's buffers were built for a world of rare, isolated shocks with long recovery windows between them. As Section 5 argues, the adversary's strategy is engineered to deny exactly those windows.
Third, the July flat price is not wrong about what it measures. Brent in the mid-$70s in contango is a defensible estimate of the probability-weighted near-term balance: the strait leaks, China is soft, OPEC+ is adding barrels, and sixty million destination-less Iranian barrels sit on the water reinforcing the glut. What no single price can express is that the conditional loss given a second closure would now be drawn against a system that has already spent its 1983-vintage insurance.
4. What the price signal cannot see
The failure here is not stupidity; it is dimensionality. A flat price is a scalar. The risk it is being asked to summarise has (at least) two components that have moved in opposite directions since February.
The first component is the probability of renewed disruption, and there is a respectable case that it has genuinely fallen. The June Memorandum of Understanding exists, however battered. Both principals have now seen the costs of a full closure — Iran's included, since a sealed strait strands Iranian barrels too. The closure that did occur proved leaky, and traders learned to discount headlines accordingly: some of July's calm is rational Bayesian updating on the observation that "closed" meant sixty per cent, not one hundred.
The second component is the conditional severity of disruption — the expected loss given that the event occurs — and every entry in the ledger says it has risen. Severity is a function of system state, and the state has deteriorated on all seven lines simultaneously. Convexity does the rest: scarcity pricing is not linear in inventory cover, as the February–June episode itself demonstrated, so an identical draw taken from a fifty-day base produces a larger price response than the same draw from seventy days. The system is further out on the steep part of its own curve.
A scalar price collapses these two components into one number, and in July the falling first component is masking the rising second. The decomposition is not merely conceptual — it is observable. The clean gauge is the spread between the physical-actuarial market and the paper market: war-risk insurance premia and hull rates for Gulf transits, against the flat price and its term structure. Underwriters price severity because they pay severity; the futures strip prices probability-weighted averages because that is what settles. Through the spring these two markets diverged instructively — premia held while transits recovered — and the same divergence, monitored now, is the fragility gauge this piece proposes. It is already registering. On 9 July, with Brent in the mid-$70s and the Brent–Dubai structure in contango, Marsh — the world's largest marine broker — put war-risk cover for a Hormuz transit at two to six per cent of a vessel's value, against roughly a quarter of one per cent before the war and a peak near ten per cent at the height of the fighting; in the hopeful weeks before the strikes, rates had drifted below two. (These are headline rates, before the no-claim discounts owners typically negotiate — the direction, not the last decimal, is the signal.) Brokers reported fewer requests for quotes as owners quietly pulled back from the strait. And one layer further down, easy to miss: even this actuarial signal is an administered one. Since March, a US government reinsurance facility — launched at $20 billion, expanded to $40 billion by April, half of it carried on the state's own account — has held a floor under the private war-risk market. The two-to-six per cent the underwriters quote is a subsidised price, not a market-clearing one; strip the state's balance sheet out of the market and the severity reading runs higher still. The paper market and the actuarial market are already disagreeing about the same water — and the list of parties with claims exposure now includes the American state.
5. The controller closes the loop
Everything to this point treats the disruption as weather: an exogenous event with some probability and some severity. The Compound Cascade framework makes a stronger claim, and the events of 8–9 July are its cleanest evidence to date: Iran's Hormuz strategy is not weather. It is a feedback controller, endogenous to the system it acts on, and it reads the market's output as an input.
Consider what the 8 July episode looks like from the controller's side. Two missiles fired at commercial shipping; one vessel burning; a superpower's president declaring the ceasefire over — and a price response an order of magnitude below February's: under five per cent, half of it surrendered within a session. In control terms, Iran has just measured the plant's transfer function and found the damping high. The experiment cost little, risked little, and returned a precise, publicly-quoted answer: the market no longer prices our escalation.
That answer feeds directly back into the controller's cost-benefit calculus, in two directions at once. It lowers the expected cost of the next probe, because escalation that does not move prices does not trigger the economic-pain thresholds that discipline all parties. And it raises the required amplitude of any deliberate signal Iran wishes to send, because a habituated market must be shocked harder to register the message at all. Both effects select for escalation. A market that yawns at burning tankers is not a stabilising force; it is an instrument mis-reporting to every actor calibrating against it — Tehran included.
This is what makes the current fragility compound rather than merely additive. Buffer depletion is a state variable. Signal habituation is a measurement failure. An adaptive adversary is a control loop. Any one of them alone is survivable; the three coupled together describe a system whose conditional severity is rising, whose instruments cannot see the rise, and whose principal antagonist is incentivised by the instruments' blindness. February's crisis consumed the buffers. July's calm is consuming the signal. The controller watches both.
6. The demonstration: one storm, hitting twice
The claim that severity has risen while probability has fallen is quantifiable, and the quantification is deliberately simple. Take a single Hormuz re-closure scenario — severity, duration, and leakage drawn from distributions calibrated to the observed February–June episode — and run it twice through a stock-flow price model: once against the January 2026 system state, once against the July 2026 state from the ledger above. Identical shock draws, common random seeds, ten thousand paths. Every difference between the two output distributions is then attributable to the state of the system and nothing else. The same storm, hitting twice.
The model earns the right to run the counterfactual by first reproducing reality: initialised at the January state with the shock parameters that actually occurred, it must backcast the observed episode — Brent's path from $67 to the April peak, the compression in demand cover, the 3.8 million barrel-per-day draw pace, the second-quarter demand response — before any hypothetical is entertained. The price map's convexity is calibrated from that episode, not chosen; the February–June crisis supplies its own transfer function, and the transfer function implies the asymmetry.
This experiment was pre-registered before the model was first run, and the pre-registration deserves an honest accounting, because it was half wrong. The expectation, recorded on 10 July before the first ensemble: a material rightward shift and tail-fattening of the July distribution, with divergence concentrated above the 90th percentile — median outcomes similar, catastrophic outcomes substantially worse — and a commitment that if the run did not show this, the thesis failed its own test and would be revised.
The first run, on provisional cover data, returned a split verdict. Direction: confirmed, emphatically — the July state produces worse outcomes across the entire distribution. Shape: falsified. The divergence is broad, not tail-concentrated; the median outcome is materially worse too, because convexity from a lower cover base drags even a middling shock down the steep part of the curve. The mechanism this piece proposes turned out to work harder than its author pre-registered, which is a stranger and less comfortable finding than being simply right. It is reported here, rather than quietly rewritten, because a pre-registration amended after contact with the data is worse than none. The magnitudes below are stated as ranges across the plausible cover band; the single final marker follows when the July IEA Oil Market Report lands mid-month.
The results are stated as ranges, because the July starting cover is not yet final, and the lead exhibit is drawn to make that honest. It is a breach-probability sweep: the chance that demand cover falls below a given threshold at some point over a 180-day horizon, plotted against the level of cover the system starts from, as two curves — the January absorber state and the July one. The figure the IEA will confirm mid-month lands somewhere in a 48-to-58-day band, and the sweep already carries the answer across that entire band, so the pending number drops a marker on a curve that already exists rather than changing the shape of the finding.
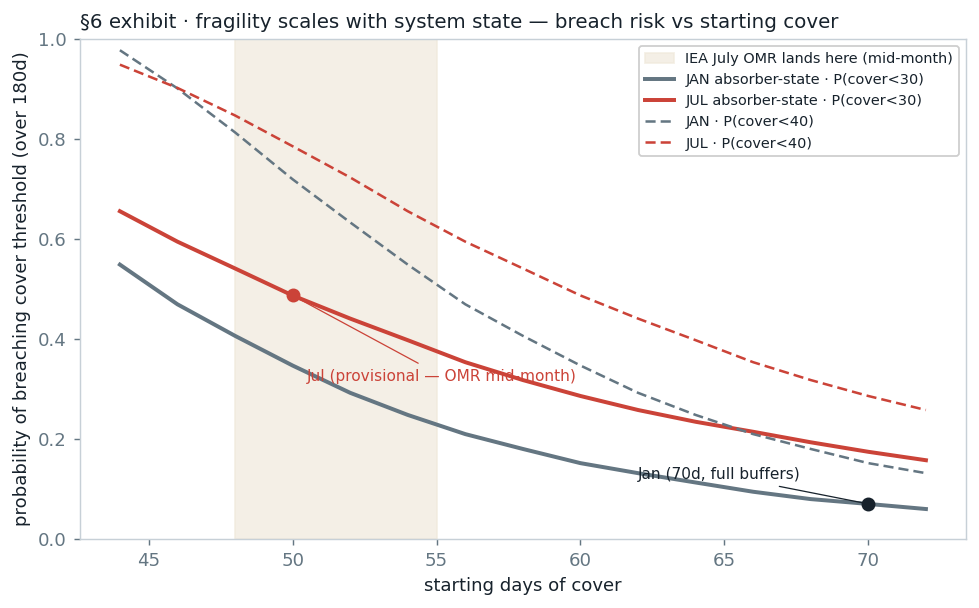
Figure — Breach risk versus starting cover, January (grey) and July (red) absorber states; solid = P(cover < 30d), dashed = P(cover < 40d). The shaded band is where the IEA July OMR figure will land. The exhibit is drawn to be robust to that pending number: when it lands, it drops a single marker on a curve that already exists.
Within that band, the probability of demand cover falling below forty days — the level at which allocation and administrative rationing began to surface in round one — runs between fifty-four and eighty-four per cent in the July state, against fifteen per cent in January. The probability of breaching thirty days runs between thirty-two and fifty-four per cent, against seven. Expected time spent below the forty-day line: between 49 and 81 days, against twelve. The width of those ranges is the honest measure of what the OMR will settle; their floor is the finding. Even at the most favourable starting cover in the plausible band, a re-closure drawn from the very shock distribution the system survived in the spring is more than three times likelier to force the July system into rationing than the identical shock would have been in February — and closer to five and a half times at the band's low end. The point estimates the mid-month figure fixes will fall inside these ranges; the ranges are the published result.
The maximum-price distributions tell the same story and are reported only to the ninetieth percentile, flagged out-of-sample: beyond the cover range round one actually visited, the price map is extrapolating, and its far tail is bounded by a demand-destruction ceiling that should be read as a floor on severity, not a forecast of it. The signal that does not depend on that extrapolation is the cover-breach sweep above — which is why it leads. The single OMR marker and the finalised point estimates follow mid-month, per the editorial note above.
Two modelling choices are worth declaring because both were resolved against the thesis. The floating-storage overhang — the destination-less Iranian barrels that read as glut before a closure — flips sign during one: cargo already outside the strait when it shuts finds buyers immediately in a suddenly short market, and is modelled as a small windfall buffer (O ≈ 60 mb, clearing discount-gated) rather than ignored. And the shock is held exogenous — the framework's controller feedback, under which the adversary escalates because the signal is damped, is excluded from the simulation entirely. The results are therefore a lower bound on the compound effect, not an upper one.
7. What would prove this wrong
An argument of this shape owes its readers falsifiers, because its failure mode — the permanently fragile system that never quite breaks — is the perma-bear's disease, and the way to avoid it is to specify in advance what recovery looks like.
Four observables would each weaken the thesis, and together would refute it. Rapid SPR refill: exchange-return contracts executing early, or fresh procurement funded, pulling the recovery date materially forward from 2028. OECD restocking ahead of the 2027 schedule, visible in the monthly IEA stock tables as the supply rebound lands. Insurance convergence: Gulf war-risk premia and hull rates compressing toward pre-conflict norms while transits normalise — the physical market agreeing with the paper market, rather than merely being outwaited by it (as of 9 July the reading still runs the other way: cover at two to six per cent of hull, quote requests thinning — though the Lloyd's market's own assessment, that the conflict has been more a volume challenge than a pricing opportunity and that cover has remained available at a price, is exactly the kind of evidence that would count toward convergence). And controller quiescence: a sustained absence of probing behaviour following MOU enforcement, which would suggest the July strikes were terminal noise rather than calibration.
The strongest standing counterargument deserves its own paragraph rather than a footnote. Closures are leaky — round one proved it — and leakage caps severity. If the effective loss in any re-closure is held to a third or less of nominal flows by dark transits and tolerated corridors, the depleted buffers may never be seriously tested. This is a real constraint, and the modelling stresses it directly: leakage is drawn across its full observed range in every simulated path, and the state divergence survives even the leakiest draws — a maximally-leaky, brief July re-closure still carries breach risk well above a January median, though a severe, tight January shock can exceed a mild July one, so the two states are not disjoint. But note what the leakage defence concedes: it is an argument that the shock will be small, not that the system is strong. It defends the probability leg, which this piece has already granted, and says nothing about the severity leg, which is the claim.
Nor should the thesis be mistaken for a price call. Nothing here implies Brent must rise; the base case — a leaky peace, soft demand, returning supply — points the other way, and the EIA's $74 third-quarter average is as good a modal estimate as any. The claim is narrower and stranger: that the distribution around any such point estimate has become severely asymmetric, that the asymmetry is invisible to the instrument everyone watches, and that the party best positioned to exploit the asymmetry is also the one who controls the trigger.
The watchlist. Four series, all public or near-public, track the thesis in real time: the weekly SPR level against the ~250 million barrel operational floor, and any refill procurement against it; OECD commercial stocks against the sub-2.3-billion-barrel December projection, updated monthly; the spread between Gulf war-risk insurance rates and the Brent flat price, weekly; and OPEC+ actual production against quota once the 2023 cuts are fully unwound, which converts "spare capacity" from press-release fiction to measurable fact. When three of the four turn, the system is healing. Until then, the calm is not resilience. It is a system running on the last of its margin, watched by a market that has stopped pricing margins, probed by an adversary that has noticed.
Sources and data
US Strategic Petroleum Reserve levels: EIA Weekly Petroleum Status Report / US Department of Energy (weeks ending 26 June and 3 July 2026); release authorisation per Energy Secretary statement, 11 March 2026. IEA coordinated release and OECD government/industry stock data: IEA Oil Market Report, May and June 2026 editions. US commercial crude, product stocks, and refinery utilisation: EIA Weekly Petroleum Status Report, week ending 26 June 2026. OECD inventory projections, shut-in estimates, and price forecasts: EIA Short-Term Energy Outlook, June and July 2026 editions. OPEC+ production decisions: OPEC+ statements, meeting of 5 July 2026 and prior. Hormuz flow and transit data: IEA OMR; Bloomberg vessel tracking. SPR refill mechanics and exchange schedule: DOE solicitation documents and RBN Energy analysis (86 mb first exchange solicitation, returns scheduled Nov 2026–Sep 2028, recovery ~mid-2028; verified against DOE releases). Market events of 8–9 July 2026: UKMTO advisories; agency reporting. War-risk insurance rates and market conditions: Marsh (Marcus Baker, global head of marine; Dylan Saunders-Mortimer, UK war leader) via Bloomberg-licensed reporting of 9 July 2026 and Insurance Business coverage of 9–10 July 2026; Lloyd's List Intelligence transit observations (no vessel above 10,000 dwt transiting the US-coordinated Omani corridor with AIS active since 7 July 2026; at least two crossings believed dark); Lloyd's Market Association (Neil Roberts) comments. US maritime reinsurance facility: US International Development Finance Corporation, announced March 2026 and expanded to $40 billion by April 2026, Chubb lead underwriter with Travelers, Liberty Mutual, Berkshire Hathaway, AIG, Starr and CNA participating, half government-assumed, per Insurance Business reporting. Floating storage: Vortexa weekly global series (week to 10 April 2026); Iranian oil-on-water estimates per Vortexa and Kpler as reported 2 July 2026; the EIA Short-Term Energy Outlook energy-security supplement of 7 July carries EIA-adjusted Vortexa oil-on-water, and the EIA cautions that Hormuz AIS data has been especially unreliable since end-February 2026. Days-of-cover figures: ~50 days on available computations (derived from market commentary), pending direct recomputation from the IEA July OMR stock and demand tables, mid-month; this analysis will be updated on publication.
Methodology and reproducibility: the severity estimates use the Compound Cascade systems-modelling framework and a buffer-state Monte Carlo — set out in full in a companion methodology specification, and calibrated to and validated against the February–June 2026 episode before any counterfactual was run. The specification, model code, and configuration files are available on request.