A data-led critique of the International Energy Agency’s flagship publication. The WEO’s scenario architecture, oil demand projections, price assumptions and supply-side claims are tested against the very crisis it documents.
EuroOilWatch · 20 November 2026 · Critical Review · Oil Watch Network · Commentary — not investment advice
Executive Summary
The International Energy Agency’s World Energy Outlook 2026 (WEO-2026), published in November 2026, is the first flagship Outlook written in the middle of the largest energy supply shock that the world has faced. As a chronicle of the 2026 Strait of Hormuz crisis it is genuinely impressive: the Agency documents a peak loss of 16.1 million barrels per day (mb/d) of global oil supply, cumulative losses of 2.8 billion barrels of oil and 60 billion cubic metres of gas from the Gulf, and its own largest-ever co-ordinated release of 400 million barrels of emergency stocks. As a work of forecasting, however, the report is considerably less persuasive. The same publication that reports diesel prices above USD 200 per barrel goes on to project crude oil back to USD 75 per barrel by 2035 (USD 70 by 2050), oil demand that plateaus at the same roughly 102-103 mb/d level the Agency has been pointing to since 2022 (only the arrival date keeps moving), and a crisis response — the Additional Response Case — that changes projected warming in 2100 by just 0.1°C. This review examines the WEO’s scenario architecture, demand and price projections, supply-side judgements and transition narrative, and finds a report whose crisis reporting is far stronger than its crisis forecasting.
- Above USD 200/bbl — Diesel prices hit record levels well above USD 200/bbl in Europe and the US in September 2026
- 16.1 mb/d — Peak global oil supply loss - by far the largest disruption in modern history
- 2.8 bn bbl — Cumulative oil supply lost from the Gulf in 2026, as of November
Our overall assessment is summarised below. The WEO-2026 earns high marks for the quality and candour of its crisis documentation, and some credit for its honest treatment of coal and refining economics. It earns poor marks for scenario design that never names a forecast, for price assumptions that jump from crisis to equilibrium without ever showing the market path between, and for supply-side revisions — most notably a 0.9 mb/d upward revision to projected Venezuelan output against WEO-2025, to 1.5 mb/d in 2035 (50 percent above 2025 output), resting on USD 70 billion of new investment — that strain credibility.
| Review area | Verdict | Score | Rationale |
|---|---|---|---|
| Crisis documentation | Strong | 8 / 10 | Superb data on supply losses, stock releases, chokepoints and market impacts. |
| Scenario architecture | Weak | 4 / 10 | Three scenarios and two cases, unweighted, with no designated central forecast; the decisive Hormuz normalisation assumption is stated openly, but its failure path is never quantified. |
| Oil demand projections | Guarded | 5 / 10 | Near-term demand has repeatedly been revised up; the plateau rests on fragile, opposite-direction offsets. |
| Price assumptions | Guarded | 4 / 10 | The equilibrium-path method is stated openly, but the market path from the above-USD 200/bbl diesel shock to USD 75 crude by 2035 is never quantified; the ARC prices gas for security but not oil. |
| Supply-side realism | Guarded | 5 / 10 | Venezuela revision to 1.5 mb/d is credulous; bypass pipeline and LNG analysis is stronger. |
| Transition narrative | Guarded | 5 / 10 | The crisis-accelerates-transition narrative is asserted more than demonstrated; the NZE’s normative-benchmark role is not consistently labelled. |
Table 1: Oil Watch Network scorecard for the IEA World Energy Outlook 2026.
1. The Report at a Glance
The WEO-2026 opens with an event no previous Outlook has had to absorb: the near-closure of the Strait of Hormuz. Following US and Israeli strikes on Iran at the end of February 2026 and Iran’s subsequent restriction of transit through the Strait, oil flows collapsed from roughly 20 mb/d — about 20 percent of globally traded oil — to an average of around 3 mb/d in March, April and May. The IEA documents how Gulf exports ebbed and flowed with the security situation through October, how LNG flows (110 bcm passed through the Strait in 2025, with no feasible bypass) fell to a fraction of normal levels, and how damage to Qatar’s Ras Laffan facility removed more than 17 bcm per year of LNG capacity that will take an estimated three years to restore. Roughly three-quarters of the world’s population lives in oil- and gas-importing countries, and the Agency notes that import spending on oil and gas will rise to USD 1.6 trillion in 2026, up 25 percent on 2025, even as demand falls.
Against this backdrop, the Outlook presents three scenarios and two cases rather than one future. The Current Policies Scenario (CPS) extends policies already in place; the Stated Policies Scenario (STEPS) adds measures formally put forward but not yet adopted; the new Additional Response Case (ARC) explores actions that are “under consideration by governments, even if they are yet to be turned into formal policy proposals”; the Low Hormuz Case (LHC) asks whether the world could manage without the Strait; and the Net Zero Emissions by 2050 (NZE) Scenario provides the normative benchmark. The CPS and STEPS (and, by extension, the two new cases) assume a continued easing of constraints on Gulf exports and “sufficient stability to allow for unimpeded transit through the Strait by the end of 2027” — arguably the single most consequential assumption in the entire report, stated openly but never tested against the market path of its own failure.
| Scenario | Definition | Key 2035 outcomes |
|---|---|---|
| CPS | Policies and regulations firmly in place today; least scope for change. | Oil demand 106.2 mb/d, rising to 114.0 mb/d by 2050; IEA crude USD 85 in 2035; warming 2.9°C. |
| STEPS | Adds measures formally put forward but not yet adopted, including crisis responses. | Oil plateaus near 103 mb/d by 2030, 101.7 mb/d in 2035; IEA crude USD 75; warming 2.5°C. |
| ARC | New case: measures under consideration but not yet formal policy proposals. | Oil about 4.4 mb/d below STEPS (around 97 mb/d); LNG demand hit; warming 2.4°C. |
| LHC | Stress test: could the system manage without Hormuz transit? | Bypass pipelines, higher non-Gulf output and demand measures cut required Strait transit to 2 mb/d by 2035. |
| NZE | Normative pathway to net zero energy emissions by 2050 and 1.5°C. | EVs displace 15 mb/d of oil demand; renewables and nuclear near 90% of power; warming peaks below 1.7°C. |
Table 2: The five WEO-2026 scenarios and cases. Source: IEA, WEO-2026, Chapters 2-6 and Annex A.
The headline claims are by now familiar from recent vintages of the Outlook: oil demand levels off “at around 103 mb/d by 2030 before entering a slow decline” in STEPS; natural gas demand rises to the mid-2030s before plateauing; renewables reach 45-50 percent of electricity generation by 2035 from 33 percent today; and nuclear power — with nearly 90 GW under construction, the highest level in more than 35 years — could, the IEA says, grow faster than electricity demand. Solar PV’s 600 TWh increase in 2025 was, the Agency notes, the third-largest ever achieved by any energy source in a single year. These claims are presented with the Agency’s customary authority. Whether they withstand scrutiny is the subject of the rest of this review.
2. Scenario Architecture: Hedging Without Accountability
The WEO’s three main scenarios have been joined by two new cases, and the addition of the ARC is presented as a response to heightened uncertainty. In practice, the ARC is the clearest example of the Outlook’s core weakness: it is a scenario built not on policies that exist, but on policies that governments are “considering” and have “often not yet formalised in legislation or detailed proposals” (Chapter 5). A scenario of imagined policies produces imagined outcomes: the ARC shaves roughly 4.4 mb/d off oil demand in 2035 relative to STEPS, yet delivers projected warming in 2100 of 2.4°C instead of 2.5°C. The Agency concedes the point itself: “the overall reduction in emissions is only slightly faster than in the STEPS” and is partly offset by higher coal use. Judged as climate analysis, in other words, the ARC is negligible — a finding the executive summary itself is honest about. Judged as security analysis, it earns its place: the case cuts projected global oil trade in 2035 by 12 percent, or 5 mb/d, a quantified picture of what a serious crisis response would do to import dependence. The ARC is best read as a security thought experiment wearing decarbonisation clothing — not a hedge, but also not, in climate terms, very much analysis at all.
The deeper problem is what the scenarios share rather than how they differ. The CPS and STEPS — and, by extension, the two new cases — assume the crisis essentially ends: the scenarios “assume a continued easing of constraints on Gulf exports and sufficient stability to allow for unimpeded transit through the Strait by the end of 2027.” This is a heroic assumption, given that the Outlook was published while the crisis was still unresolved and its own account shows flows collapsing, rebounding and falling back through 2026. If Gulf transit does not normalise by end-2027 — if, say, Qatari LNG capacity remains offline for the three years the IEA itself estimates — then every demand, price and trade projection in the report is anchored to a premise the report itself calls uncertain. The Agency would fairly object that it does examine the alternative: the Low Hormuz Case, the report says, “asks whether and over what time horizon the world could manage without energy flows through the Strait of Hormuz”, and Chapter 2 notes that the ARC and LHC become more relevant under “a prolonged stalemate or recurring bouts of hostilities”. But the LHC answers a different question — how the world could adapt to life without the Strait — and it models an adapted end-state, not the route there. What no case in the report quantifies — beyond a single 2035 estimate of an LNG deficit of around 230 bcm (Box 5.4) — is the market path if the decisive assumption fails: what crude and LNG prices do in 2028 if transit has not normalised, how much demand is destroyed, what the fiscal hit to importers looks like. The scenarios are thus asymmetric: enormous imagination is expended on decarbonisation pathways, while the transition out of the single risk that dominates 2026 gets an assumption rather than an analysis.
The deeper accountability problem is not that the fan is wide — it is that the Agency refuses to say which leaf of the fan it believes. The spread between the CPS and STEPS in 2035 is just 4.5 mb/d, or roughly 0.4 percent per year of divergence in total demand: in arithmetic terms, this is a precise forecast. But with CPS at 106 mb/d, STEPS at 101.7 mb/d and ARC near 97 mb/d in 2035, and no probabilities attached to any of them, almost any realised outcome will fall inside the suite — and because no scenario is designated as the central case, none can ever be called wrong. A single named forecast with a 4.5 mb/d spread would be a falsifiable claim; five unweighted futures with the same spread are an alibi. The Agency should say which future it expects, and mark that forecast honestly when it misses.
3. Oil Demand: A Plateau Balanced on Fragile Offsets
The WEO-2026’s central demand claim — that oil use “levels off at around 103 mb/d by 2030 before entering a slow decline” in STEPS — deserves close scrutiny, because the Agency’s plateau has been remarkably stable across four consecutive editions: the level has barely moved from roughly 102-103 mb/d, while the arrival date has actually been brought forward, from the mid-2030s in WEO-2022 to around 2030 today. The recurring error is therefore not a plateau that keeps slipping away — it is near-term demand that keeps being under-called. WEO-2024’s STEPS projected world oil demand rising from 97.1 mb/d in 2022 to 101.7 mb/d in 2030; WEO-2026 reports 102.2 mb/d already in 2025 (Annex A, Table A.9) — above the level that path had set even for 2030. Historical data are revised between editions, so the comparison is directional rather than a like-for-like audit — but the direction is consistent. The 2026 crisis was the acid test of the plateau thesis: the largest energy supply shock that the world has faced, record prices, demand destruction — and yet the CPS still has oil demand rising to 106.2 mb/d in 2035 and 114.0 mb/d in 2050. If a crisis of this magnitude cannot bend the demand curve in the no-new-policy scenario, the question is whether the structural deceleration assumed in STEPS is real or merely assumed. The plateau therefore balances two opposite uncertainties: the upside risk that near-term demand is under-called again, and the downside risk that the fragile offsets holding it in place fail to deliver.
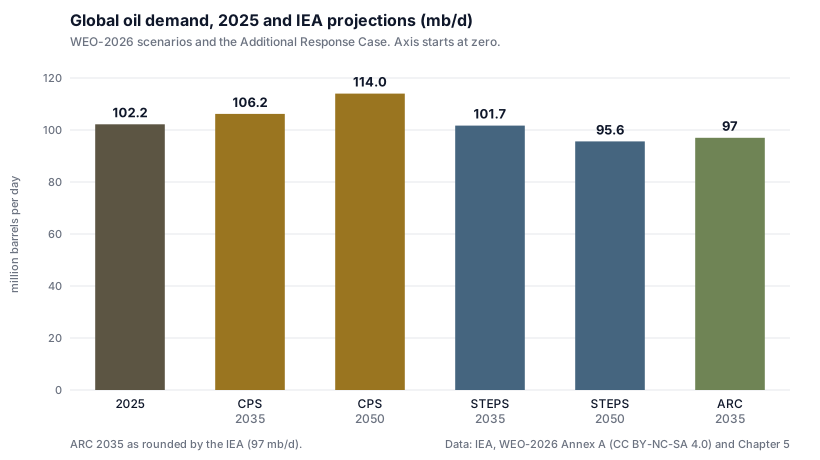
Figure 1: Global oil demand, 2025 and projected (mb/d). The entire CPS-to-ARC spread in 2035 is about 9 mb/d. Source: IEA, WEO-2026, Table A.9 and Chapter 5. Data: IEA, WEO-2026 Annex A, CC BY-NC-SA 4.0.
The internal composition of the STEPS plateau is also more fragile than the headline suggests. Electrification, efficiency and biofuels “cut passenger car oil use” through 2035, but the report’s own offset statement — a combined increase of 5 mb/d for petrochemicals, aviation and heavy trucks — is made about the CPS; in STEPS the residual growth is led by aviation (up 25 percent) and petrochemical feedstock (up 17 percent). Feedstock data in Annex A confirm the momentum: LPG and ethane demand grows from 15.0 mb/d in 2025 to 17.8-18.6 mb/d in 2035, and naphtha from 7.0 to 8.0-8.3 mb/d. Petrochemical growth is real, but it is not automatic: it depends on continuing build-out of crackers in Asia and the Gulf, on plastics consumption growth that is increasingly contested by regulation, and on recycling rates that the Outlook itself says are rising. A plateau forecast that depends on petrochemicals doing exactly what petrochemical producers plan, while passenger oil use does exactly what electrification plans dictate, is not a robust central case — it is two opposite bets stacked on top of each other.
Diesel is the sharpest test case. The WEO documents diesel as “the workhorse of the global economy,” under “extreme pressure” with prices above USD 200 per barrel — a level that weighed on diesel use and dominated the crisis. Yet the projection that emerges from this traumatic year is global diesel demand of 28.3 mb/d in 2035 in the CPS and 27.1 mb/d in STEPS, against 28.0 mb/d in 2025. The fuel at the centre of the crisis is projected essentially flat for a decade. Either the crisis taught demand-side lessons that the model has not captured, or the model believes the crisis will be forgotten — and in both cases, the report owes readers a better explanation than it gives.
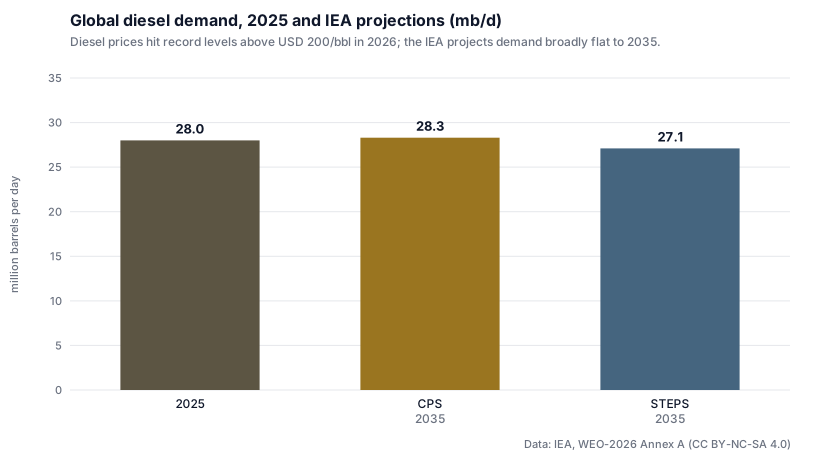
Figure 2: Global diesel demand, 2025 and projected (mb/d). After the record diesel crisis, the IEA projects the fuel essentially flat to 2035. Source: IEA, WEO-2026, Table A.10. Data: IEA, WEO-2026 Annex A, CC BY-NC-SA 4.0.
The electrification offset the Agency leans on is genuine: China’s EV fleet already avoids about 1.5 mb/d of oil demand — the Agency’s own data point and a powerful one. It is also the load-bearing element of the plateau’s decline phase. Even in the ARC — the crisis-response case, not a normative pathway — EVs are assumed to displace “more than 11 mb/d” of oil demand by 2035, more than six times the 2025 level. That assumption rests on supply chains — batteries, critical minerals, charging infrastructure — that the same report describes as concentrated and strained, with China the dominant refiner for 19 of 20 energy-related strategic minerals. Readers are entitled to know that the plateau’s gentle decline after 2030 is an electrification bet, and that the report itself documents the fragility of the supply chain that bet depends on.
4. Price Assumptions vs. the Crisis the IEA Itself Documents
Nowhere is the tension between the WEO’s two halves — crisis chronicle and crisis forecaster — sharper than in its price table. Table 2.2 of the report puts IEA crude at USD 68 per barrel in 2025, rising to USD 75 in 2035 and easing to USD 70 in 2050 in STEPS; USD 85 and USD 106 in the CPS; and USD 72 and USD 62 in the ARC. The NZE Scenario prices oil at USD 34 in 2035 and USD 26 in 2050. Read alongside the report’s own market chapters — diesel above USD 200 per barrel, a 16.1 mb/d supply loss, emergency stock releases of 400 million barrels, USD 1.6 trillion of import spending — these numbers describe a market very far from the one the report’s own price table projects.
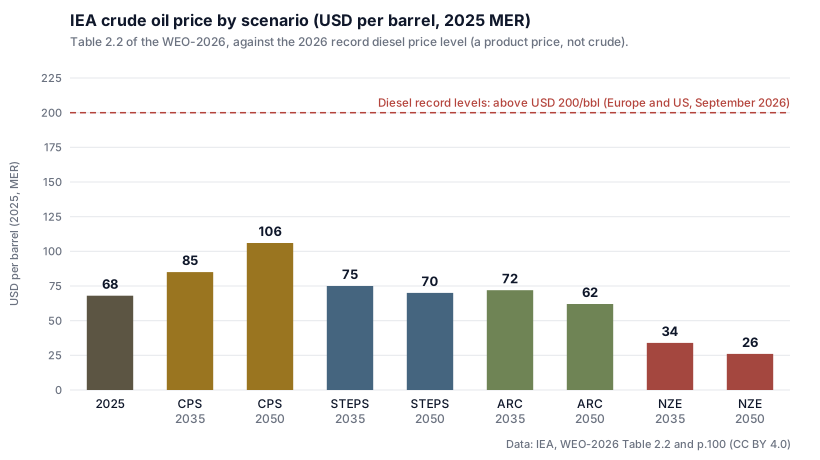
Figure 3: IEA crude oil price assumptions by scenario (USD/barrel, 2025 MER) against the 2026 record diesel price level, above USD 200/bbl. Source: IEA, WEO-2026, Table 2.2 and Chapter 2.
The Agency is upfront about its method, and the method matters for how the table should be read. The price trajectories, Chapter 2 explains, are equilibrium paths that “do not capture the short-term volatility that characterises markets in practice”; prices are assumed to remain high into 2027 before pre-crisis supply returns and pressure moderates, while allowing that “a period of lower prices” could follow as post-crisis balances loosen. An equilibrium path is a legitimate analytical object. What the report never supplies is the bridge: the market path between the crisis it documents and the equilibrium it projects. Its own sentence — “record supply losses have not so far translated into record prices for crude, thanks to ample market buffers, but these buffers are depleting and the 2026 crisis is still not resolved” — describes a live risk that the projection framework absorbs into a single clause and then sets aside. A framework that moves from an above-USD 200/bbl diesel shock to USD 75 crude in 2035 — above the USD 68 of 2025 — without quantifying the intervening years, the demand destruction or the risk of recurrence is not wrong, exactly; it is incomplete in precisely the dimension that 2026 made matter.
The clearest internal tension sits in the ARC’s own price table. In the ARC, importers pay a security premium for gas: the European Union import price in 2035 is USD 6.1 per MBtu against USD 5.7 in STEPS. Oil — the commodity actually lost in the crisis — gets no premium at all: the ARC prices it at USD 72 in 2035, USD 3 below STEPS. The report’s logic is coherent up to a point: equilibrium oil prices in the ARC are lower “because of lower demand”, and importers could encourage domestic production by easing fiscal terms for upstream investment. But those explanations govern the quantity of oil supplied, not the price of security. If buyers are demonstrably willing to pay more for gas that is less exposed to the Strait, the same behaviour should surface somewhere in oil — a premium on non-Gulf barrels, a discount on Gulf barrels, a wider risk band. That the ARC’s oil price is simply STEPS minus demand and domestic-supply incentives is an assumption about market psychology the report never defends. Meanwhile the NZE’s USD 34 price assumes “strong policy support” prevents cheap oil from triggering a demand rebound — a candid admission that the NZE is a policy design, not a market forecast, and that its price path is an instrument of the scenario’s logic rather than an output of it.
5. Supply-Side Asymmetries
The WEO’s supply-side judgements vary noticeably in rigour. The starkest example is Venezuela. The 2026 vintage lifts Venezuelan production from 1.0 mb/d in 2025 to 1.5 mb/d in 2035 — a 50 percent rise, and 0.9 mb/d above the WEO-2025 projection — on the strength of around USD 70 billion of cumulative investment as “operators refurbish existing facilities and develop new fields”. The report is at least internally consistent: it notes that returning to pre-2015 levels of 2.7 mb/d would require USD 120 billion. But a decade of sanctions, under-investment and brain drain precedes that curve, and the upward revision rests on assumed new investment — the kind of reasoning the report rightly rejects when governments justify new refineries on security grounds. The IEA attributes the rise to revised hydrocarbon laws and security improvements as well as investment, but a 50 percent re-rating of a collapsed producer, absorbed without friction, is the single least-credible judgement in the Outlook. The UAE, which left OPEC in May 2026, rises from 4.4 mb/d in 2025 to 5.8 mb/d in 2035 in the STEPS.
The treatment of Hormuz bypass capacity is more balanced and is among the report’s strongest sections. Some 7 mb/d of new pipeline projects are under construction or consideration, costing an estimated USD 40 billion and adding about USD 2 to the cost of a Middle East barrel. In the Low Hormuz Case, bypass routes supply over 60 percent of the reduction in required Strait transit — down to 2 mb/d by 2035 — with 15 percent from higher non-Gulf production and the remainder from demand measures. The Agency is right to note the caveats: bypass routes within a destabilised Middle East are themselves vulnerable, and “while it is possible to diversify away from the Strait of Hormuz over time, the same does not apply to the Middle East as a whole.” That candour contrasts favourably with the price table discussed above.
On gas, the report’s own numbers contain an unexplored contradiction. A wave of new LNG export capacity — led by the United States — is set to expand LNG supply by more than 50 percent, and the Outlook describes a prospective “buyers’ market” with prices falling to near short-run marginal cost in STEPS. Yet the same market just demonstrated, in Qatar’s Ras Laffan damage, that Gulf LNG has no bypass routes and that 17 bcm per year of capacity can vanish for three years. The report flags the risk that a second gas crisis in five years may deter import infrastructure investment — the ARC dynamic — but its central case still prices European gas at USD 5.7 per MBtu in 2035. Buyers who lived through 2026 may not behave as the central case assumes; the report’s own Additional Response Case, in which wary Asian importers invest less in import terminals, suggests as much.
Finally, the Agency’s assessment that importers’ domestic production upside is “minor” — average upstream investment by fuel-importing countries in the ARC is around 10 percent, or USD 10 billion, higher than in the STEPS — is defensible on resource grounds: most importing countries have small or mature resource bases, and incremental production needs eased fiscal terms and time. But the judgement is written into the case as much as it is derived from it. The same report calls diversification “the first golden rule of energy security” and documents 25 countries announcing new electrification-related policies within months of the crisis; if the political priority for supply security is as strong as the report says, its modest allowance for importer upstream investment is an assumption about political restraint that the report’s own narrative does not obviously support.
6. The Transition Narrative and the NZE Problem
The WEO-2026’s interpretive spine is the claim that energy security and the energy transition have converged: “many of the energy sources and technologies that enable lower fuel imports also come with lower emissions.” There is truth in this, and the report documents it well — 25 countries announced new electrification-related policies within months of the crisis, solar and battery imports surged into affected regions, and electric cars sold sharply faster across Europe and Southeast Asia. But convergence is not equivalence, and the report’s own numbers betray the gap. The ARC, the scenario in which security concerns bite hardest and accelerate transition policies, delivers 2.4°C of warming against 2.5°C in STEPS. Energy security, by the Agency’s own modelling, gets the world almost nowhere on climate — and the executive summary says so plainly when it asks whether the crisis could accelerate transitions and answers that security concerns alone will not do the job. The convergence thesis is real but bounded: the crisis speeds up policies governments were already considering; it does not bend the curve nearly far enough. A report whose interpretive spine leans on convergence while its own cases show convergence buying 0.1°C of avoided warming owes its readers a clearer statement of that gap than the narrative framing provides.
The coal story receives more honest treatment than in previous editions, which is to the Agency’s credit. Coal demand “has received a short-term boost from the crisis”, and in the ARC its decline is “slightly less steep” than in the STEPS, with the report conceding that security concerns “could keep some coal assets in the mix for longer.” But this concession sits uneasily with the report’s renewables narrative: from 33 percent of generation today, renewables reach only 45-50 percent by 2035 in the CPS and STEPS — the executive summary and the scenario tables agree on this. That is strong growth, but with nuclear supplying roughly another 10 percent, some 40-45 percent of global electricity in 2035 still comes from fossil fuels under the exploratory scenarios — slightly less in the ARC, though even there coal plants run for longer — with the crisis having added coal staying-power. The transition is accelerating; it is not yet displacing.
The NZE Scenario remains the Outlook’s structural bias problem. It is a normative construction — the report says so itself: a pathway “towards the goal of limiting global warming to 1.5°C, but not the only possible one” — yet it is repeatedly used as if it were a benchmark with evidentiary force, its milestones (renewables and nuclear near 90 percent of generation by 2035, up from 42 percent today; electrification at 35 percent of final energy and 2.2 Gt of captured CO2, both by 2035) presented alongside market forecasts. The NZE also embeds 2.7 Gt of CO2 removal by 2050, from CO2 removal technologies — a portfolio that barely exists at scale — that the report calls “now essential to limit the overshoot of temperature goals.” Essential to the pathway, yes; established in the market, no. The NZE has a legitimate role as the report’s normative benchmark — the report itself calls it one pathway, not the only one — but that role should be visible each time its milestones are quoted as if they carried the same evidentiary weight as the STEPS projections. Where analysis ends and scenario design begins is exactly the line the Outlook leaves its readers to find for themselves.
7. What the IEA Gets Right
A critique is only credible if it is fair, and the WEO-2026 contains work that deserves genuine praise. Its crisis documentation is now the indispensable public record of the 2026 shock: the week-by-week reconstruction of Gulf export flows, the quantification of the 400 million barrel co-ordinated stock release — the largest in the Agency’s history — and the honest admission that adjustment is increasingly falling “on consumers via demand destruction and high prices.” Few institutions could have produced this within the crisis itself.
Several analytical judgements also deserve credit. The report is refreshingly sceptical of refining romanticism, warning that “security-based rationales can quickly turn into expensive and open-ended subsidy commitments” when governments build new refineries for security reasons. Its chokepoint analysis extends properly beyond Hormuz to Malacca (23-25 mb/d and 200-250 bcm of LNG by 2035) and to supply-chain concentration, including the striking datum that China is the dominant refiner for 19 of 20 energy-related strategic minerals, more than half of which face export controls. Its data on electrification economics — cost-competitive potential to electrify roughly half of road transport fuel demand and half of fossil-based space heating at 2025 prices — are useful and clearly sourced. And its candour on energy access — 720 million people still without electricity, and an LPG deficit that threatens clean-cooking progress for households that recently switched — refuses to let transition optimism obscure development reality.
The report also concedes several points worth holding it to: that energy security concerns can keep coal assets in the mix for longer; that, from a financing perspective, “expectations of demand growth to a plateau or gradual decline can significantly affect” investment decisions (Chapter 1) — a warning about how sensitive real-world investment is to the demand narrative, one that applies with full force to the Outlook’s own projections; and that electrification brings genuinely new security risks — more than 2,000 cyberattacks a week on energy utilities in 2025, and around 3,000 major outages linked to natural hazards since 2022. These passages are welcome, even if the second sits awkwardly with a projection suite that never names which expectation it holds.
8. Bottom Line and Watchlist
The WEO-2026 is two documents stapled together. The first is a superb real-time chronicle of the largest energy supply shock that the world has faced, produced under difficult conditions and rich with data no other institution can match. The second is a forecast suite that assumes the crisis away by the end of 2027, moves from an above-USD 200/bbl diesel shock to USD 75 crude without ever showing the market path between the two, re-rates a collapsed producer on the strength of assumed investment, and wraps the whole in five unweighted scenarios and cases, none of which is named as the forecast that can be held to account. Readers of eurooilwatch.com, ukoilwatch.com and americasoilwatch.com should treat the WEO’s market data as essential and its central projections as one bounded opinion among several — and should hold the Agency to its own numbers. The watchlist below specifies the indicators that will show, within two to three years, whether the 2026 Outlook’s central case survives contact with reality.
| Indicator | 2025-26 baseline | WEO-2026 STEPS path | What would falsify the outlook |
|---|---|---|---|
| Global oil demand | 102.2 mb/d (2025) | Plateau near 103 mb/d by 2030; 101.7 mb/d in 2035 | Sustained growth above 1 mb/d per year pushes demand into CPS territory well before 2030 |
| Global diesel demand | 28.0 mb/d (2025); record prices above USD 200/bbl in 2026 | 27.1 mb/d in 2035 | Diesel demand at or above 2025 levels through 2028-29 despite elevated prices |
| Petrochemical feedstocks | LPG/ethane 15.0 mb/d; naphtha 7.0 mb/d (2025) | 17.8 and 8.0 mb/d in 2035 | Petrochemicals, aviation and trucks are the report’s main residual growth engine — a combined 5 mb/d rise in the CPS to 2035; build-out below plan would flatten it and pull every scenario’s path lower |
| Hormuz transit | ~20 mb/d pre-crisis; ~3 mb/d avg, March-May 2026 | Recovered to ~20 mb/d by 2035 | Incomplete recovery by 2028 would invalidate the end-2027 normalisation assumed in the CPS and STEPS |
| Venezuelan output | 1.0 mb/d (2025); WEO-2025 STEPS implied ~0.6 mb/d in 2035 (our calculation) | 1.5 mb/d by 2035 on USD 70 bn investment | Investment not translating into sustained production growth within two years would expose investment-driven modelling |
| LNG balances | Gulf capacity loss: 17+ bcm/yr at Ras Laffan; 3-yr restoration | +50% supply wave absorbed; EU gas USD 5.7/MBtu in 2035 | Delayed FIDs on import infrastructure and persistent security premiums would break the buyers’-market central case |
Table 3: Oil Watch Network watchlist for testing the WEO-2026 central case. Sources: IEA, WEO-2026, Tables 2.2, A.9, A.10; Chapters 2, 4 and 5.
None of this makes the IEA’s work worthless; it makes it accountable. The IEA’s Executive Director writes in the Foreword that “the scarcest commodity of all, in my view, is trust.” Trust is rebuilt the same way it was lost: by publishing central cases precise enough to be wrong, and by marking them honestly when they are. The 2027 Outlook, arriving as the end-2027 normalisation deadline itself arrives, will be the test.
Sources and Methodology
Reviewed document: International Energy Agency, World Energy Outlook 2026, IEA Publications, Paris, November 2026, CC BY 4.0, with Annex A under CC BY-NC-SA 4.0 (564 pages). All quantitative claims in this review are drawn from the reviewed document, principally: Executive Summary; Chapter 1 (Overview and key findings); Chapter 2 (Setting the scene, including Table 2.2 on wholesale fossil fuel prices and Figures 2.5-2.7 on the crisis); Chapter 4 (Stated Policies Scenario, Section 4.5.1 on oil); Chapter 5 (Potential additional responses, including the Additional Response Case and Low Hormuz Case); Chapter 6 (The outlook for energy transitions, including Table 6.1 on NZE key indicators); and Annex A (Tables A.8-A.11 on oil production, demand and refining). ARC oil demand for 2035 is the report’s own rounded figure of 97 mb/d (Chapter 5), consistent with its statement that ARC demand in 2035 is “about 4.4 million barrels per day (mb/d) lower than in the STEPS”. Temperature outcomes are from Chapter 6 and the Executive Summary. The cross-edition comparison in Section 3 uses the WEO-2024 STEPS projection for world oil demand (WEO-2024, Annex A, Table A.9); because historical demand data are revised between editions, that comparison indicates the direction of the Agency’s near-term revisions rather than a like-for-like audit. Cross-edition references to the WEO-2025 (Venezuela, the UAE) use the revisions the WEO-2026 itself reports.
Methodology and disclaimer: this review is independent commentary prepared for the Oil Watch Network and its publications (eurooilwatch.com, ukoilwatch.com, americasoilwatch.com). It does not represent the IEA or any of its member governments, and the IEA is not responsible for any use made of the WEO-2026 or of this critique. Where the review characterises the report’s argument, quotations are taken directly from the reviewed text. Figures 1-3 were drawn by the author from the cited tables. This document is commentary and analysis only; it is not investment advice.